Visualisation
Idea and Process
Early on in the project towards the end of digitization campaign after a significant portion of documents had been digitized and some metadata had been collected [see Digitizing], the project experimented with visualization approaches that could be realized with even this rudimentary data and that could quickly be implemented and experimented with. In the end, these approaches were not further developed in this project but are recorded here as small experiments on what directions could be taken in visualizing document collection.
Data Exploration (d3/observablehq)
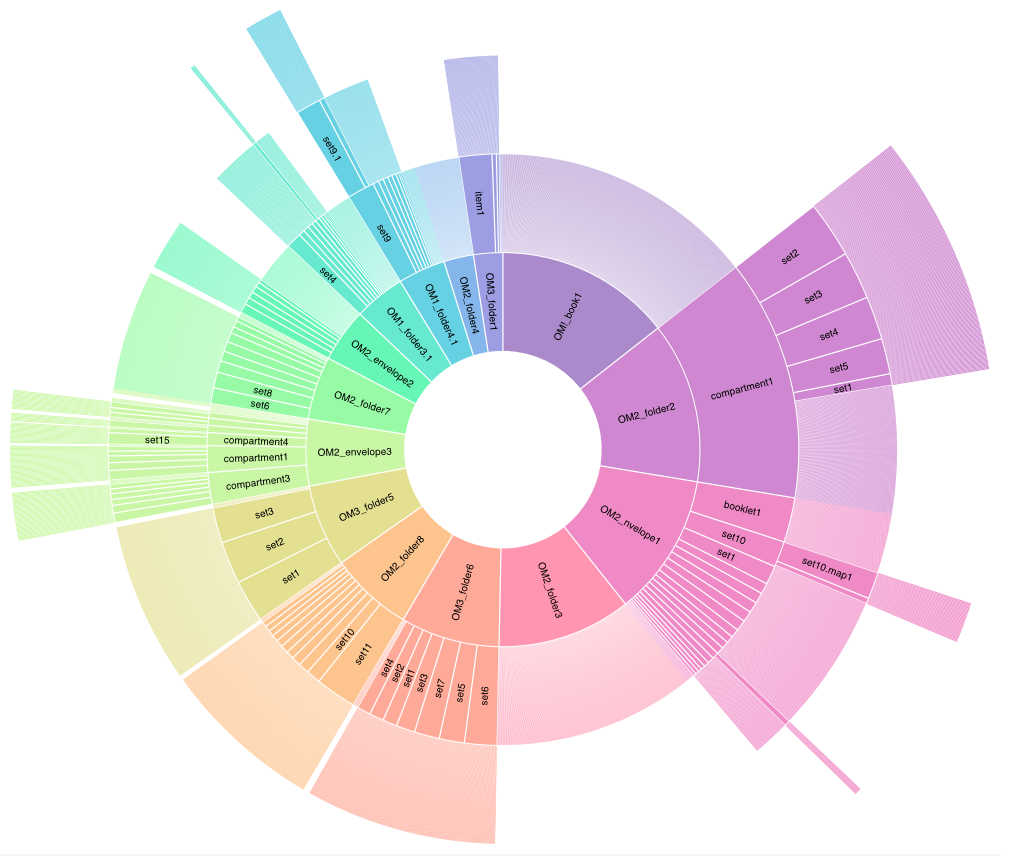
During the digitization campaign, particular attention was given to preserving the nested structure of Garfinkel’s folders and document sets. This hierarchical organization—ranging from high-level groupings down to individual compartments and items—was carefully documented and encoded into the CSV metadata. Using this structured data, a series of experimental visualizations were developed to explore and interpret the complex relationships within the collection. Among these, Sunburst diagrams proved especially effective for illustrating the multi-level nature of the archive. These visualizations were created using existing tools and platforms, such as Observable HQ, which allowed for dynamic and interactive representations of the data. The overarching aim of this effort was to better understand the internal structure of the sub-collection and to provide an intuitive visual means of navigating the digitized materials.
Exploring the Collection: Vikus Viewer
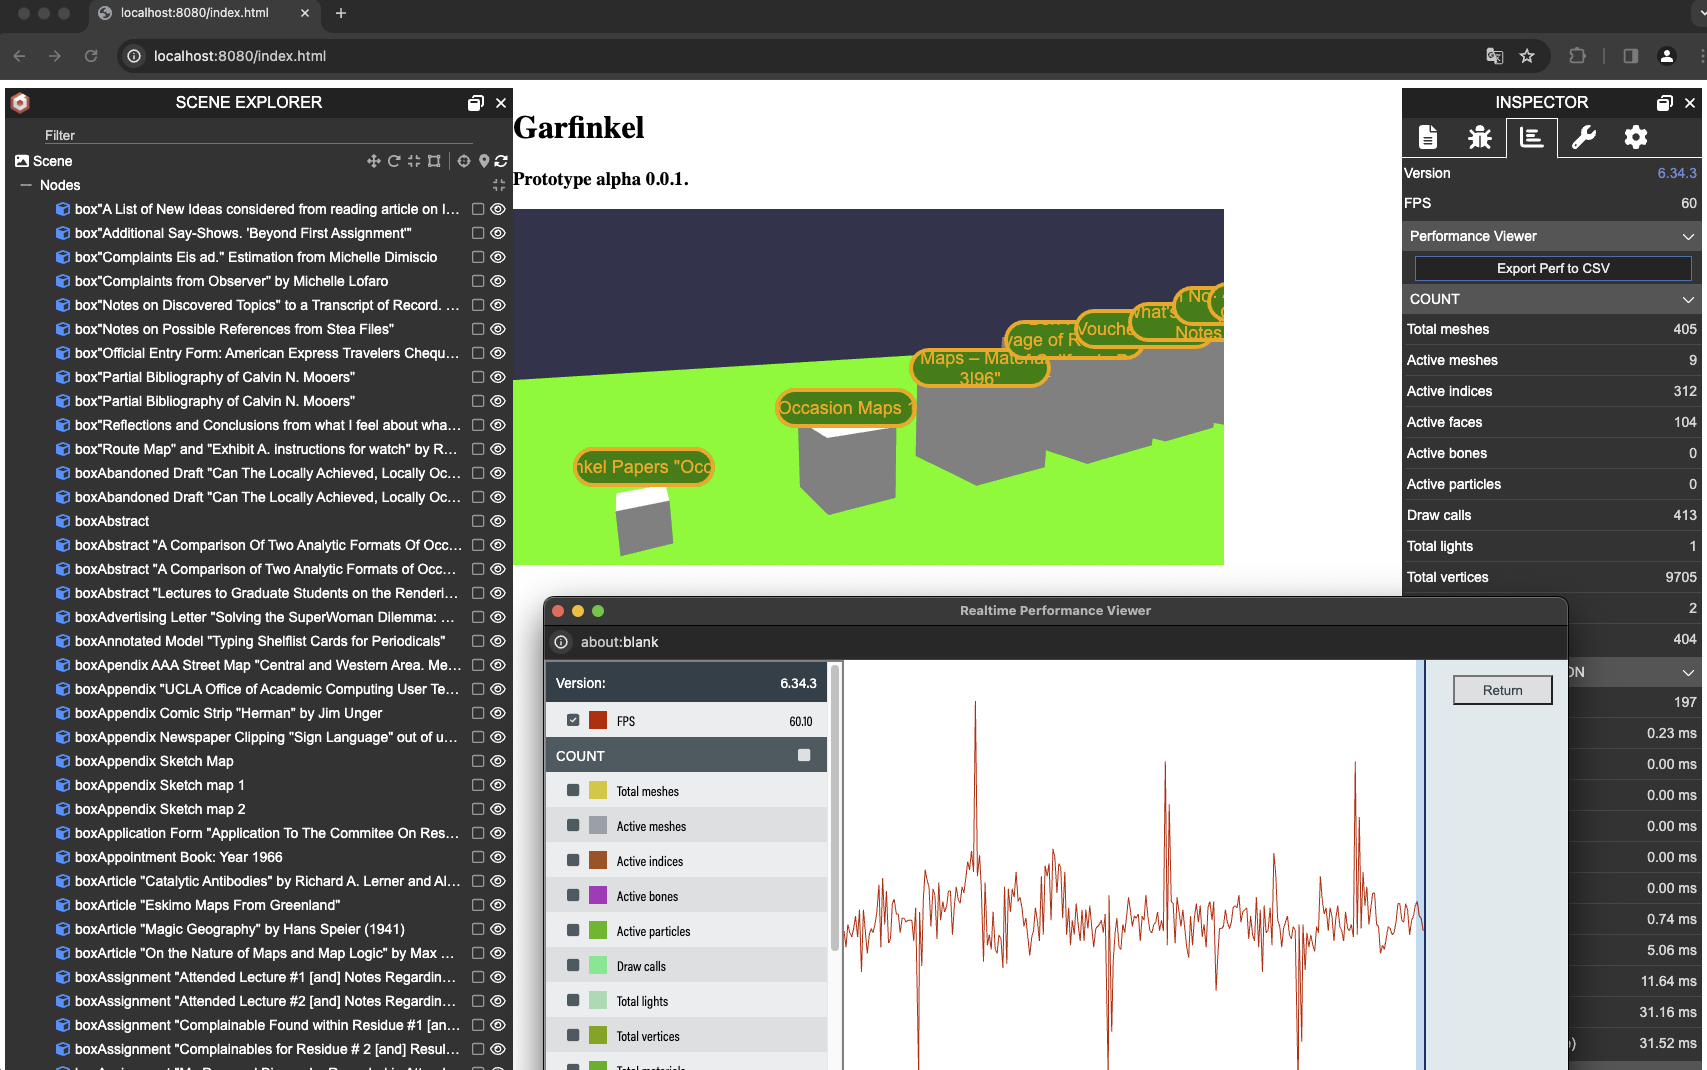
These early experiments were based on the initial metadata table and the first batch of scanned images. They employed the Vikus Viewer—an open-source software platform for visualizing cultural collections developed by the Urban Complexity Lab at the University of Applied Sciences Potsdam. The Vikus Viewer has served as the foundation for several well-known digital projects, such as the Van Gogh Atlas and Past Visions, enabling rich, exploratory interfaces to complex datasets. The core idea behind this approach to visualization is rooted in the concept of the “generous interface” —a user-centered design philosophy that aims to present users with a broad, inviting view of the collection before requiring them to search or filter . Rather than confronting users with empty search boxes, generous interfaces offer immediate access to the scope, variety, and structure of a collection, encouraging serendipitous discovery and contextual understanding. These early visual experiments explored how such principles could be applied to the digitized Garfinkel collection, helping to reveal its nested structure and inviting new forms of engagement with the material. (Due to pending right issues regarding the material the full interactive instance of the Vikus Viewer can not be publically shared at this time)
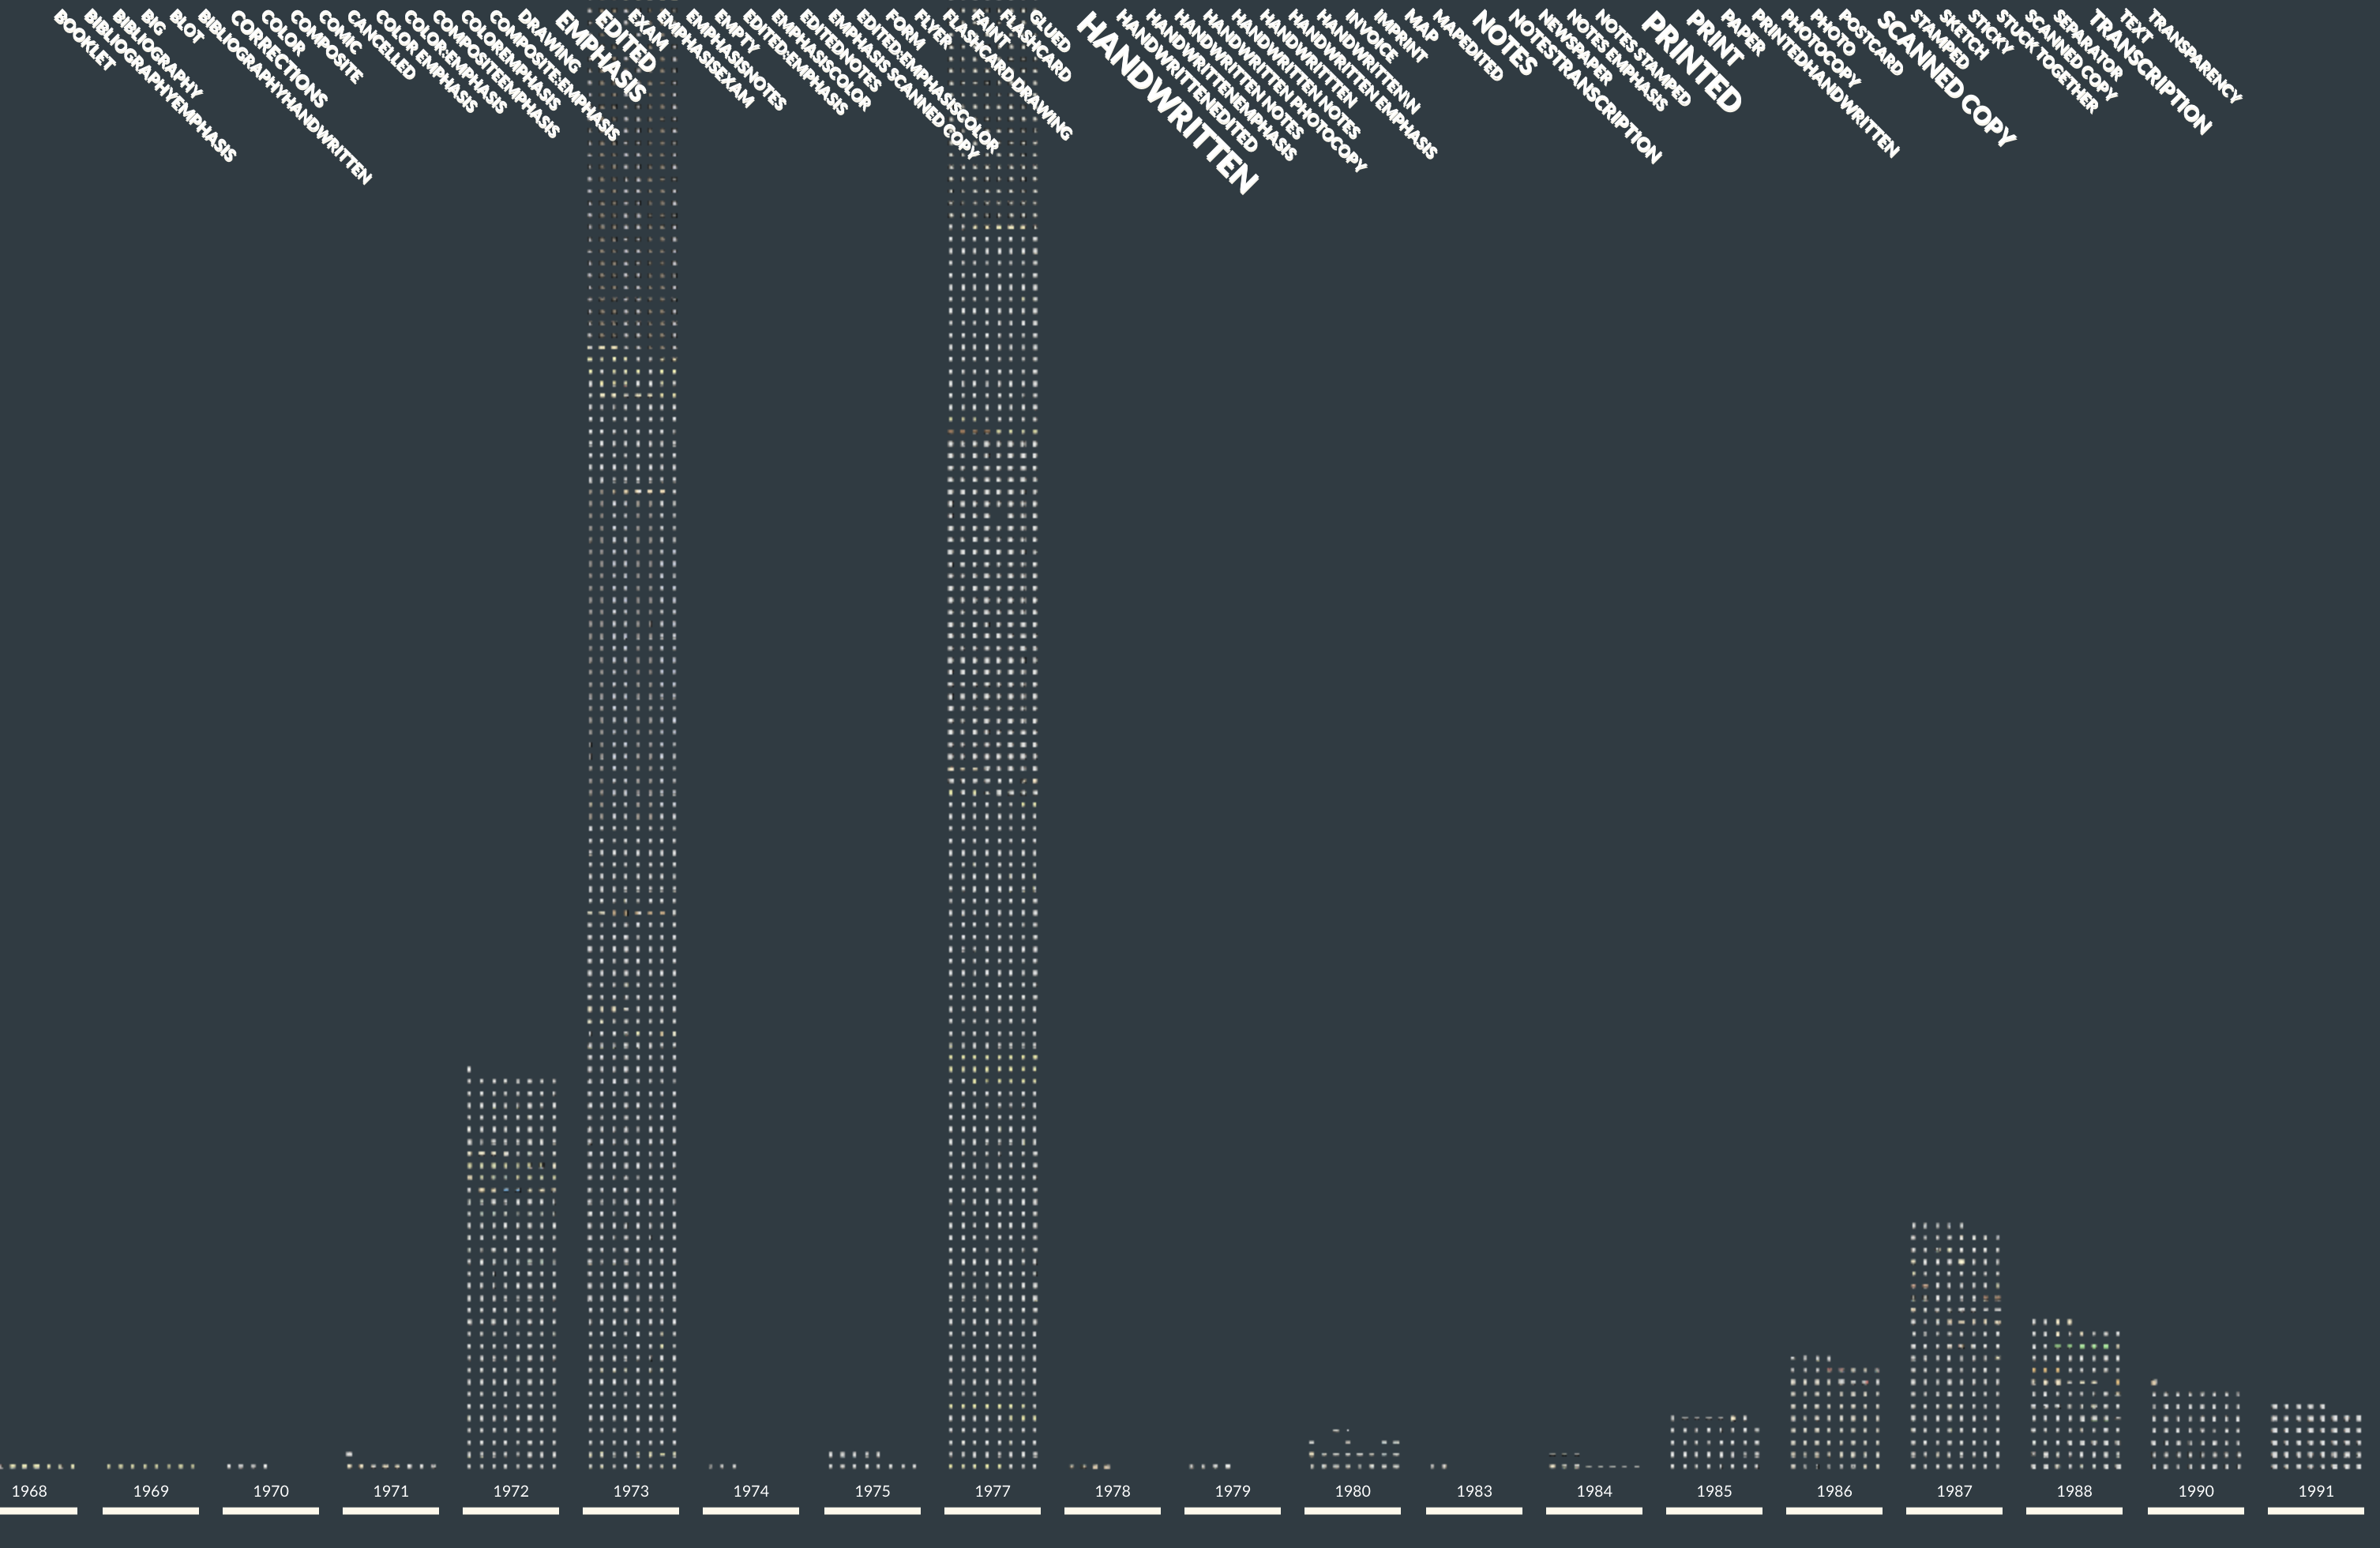
Unfinished or Discontinued Visualization Attempts